How to Make Gantt Chart
Contents page
- Unveiling the Power of Gantt Charts
- Gantt Chart Basics
- What Is a Gantt Chart Used for?
- Gantt Chart Example
- How to Create a Gantt Chart: A Step-by-Step Guide
- What to Include in Gantt Chart?
- Timeline Gantt Chart: A Key Component of Project Management
- Where to Make a Gantt Chart?
- Gantt Chart Project Management: Enhancing Efficiency and Collaboration
- Mastering the Art of Gantt Chart Creation
Try timeCamp Planner App and streamline your team collaboration
Sign up for free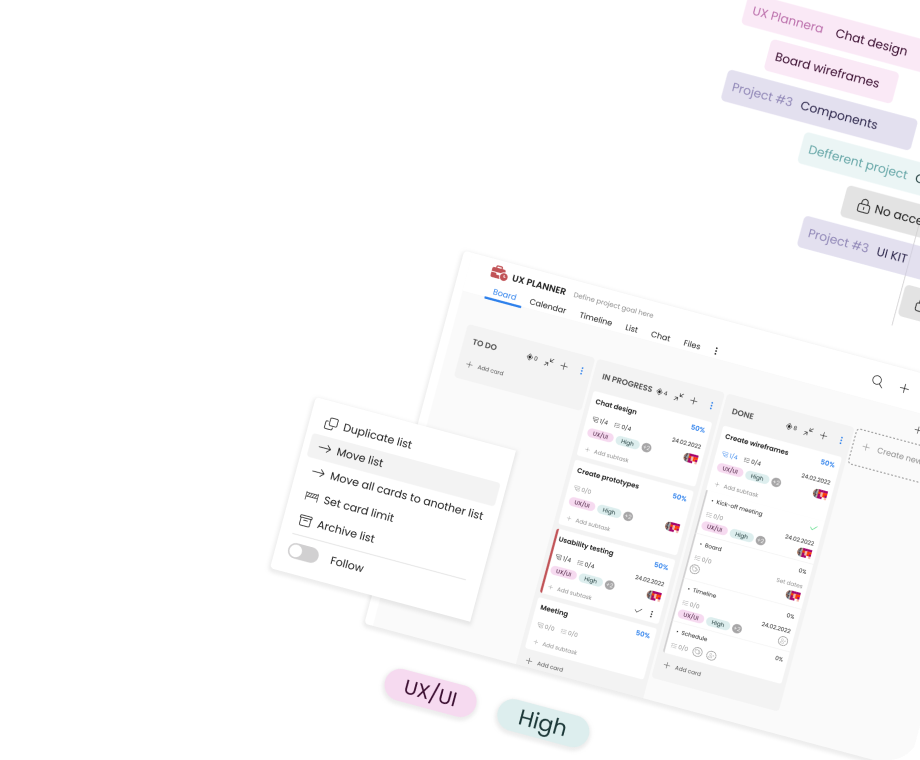
Gantt charts are a powerful project management tool that visually represents the timeline and progress of tasks within a project. They provide an easy-to-understand overview of a project's schedule, resource allocation, and task dependencies.
In this article, we will guide you through the process of creating a Gantt chart, discuss the basics, and explore how Gantt charts can significantly enhance project management.
Unveiling the Power of Gantt Charts
The Gantt chart was invented in the 1910s by Henry Gantt, an American mechanical engineer and management consultant. He developed the chart as a visual management tool to improve the efficiency and productivity of workers in the manufacturing sector.
The primary purpose of the Gantt chart was to assist in scheduling and controlling production processes. It helped to check whether the project is on track, behind schedule, or ahead of schedule.
The Gantt chart became a widely adopted scheduling tool and is still widely used today across various industries. Its simplicity and effectiveness in presenting complex project schedules contributed to its popularity, making it a fundamental tool for project planning and control. The legacy of Henry Gantt's innovation lives on, as the Gantt chart remains an essential part of modern project management practices.
Gantt Chart Basics
A Gantt chart is a horizontal bar chart that illustrates the sequence of tasks and milestones within a project. Each task is represented as a horizontal bar, with the length of the bar corresponding to the duration of the task.
The chart also displays task dependencies, indicating which tasks must be completed before others can begin. Gantt charts offer a clear visual representation of a project's schedule, making it easy for team members and stakeholders to understand the project's progress and timeline.
What Is a Gantt Chart Used for?
Gantt charts are versatile project management tools used for planning, scheduling, and tracking tasks and activities within a project. They provide a visual representation of project timelines, making it easier for project managers and team members to understand the project's progress and ensure its successful completion.
Here are some of the key purposes and uses of a Gantt chart:
-
Project planning: Gantt chart helps in the initial planning phase of a project by breaking it down into individual tasks and activities. Project managers can identify the sequence of tasks, their dependencies, and the overall project timeline.
-
Task scheduling: it's easier to assign start and end dates to each task, taking into account dependencies and resource availability. This ensures that tasks are scheduled in the most efficient and logical order.
-
Resource allocation: by visualizing the timeline and task durations, you can allocate resources effectively. It's easy to identify potential resource conflicts and adjust assignments to ensure optimal resource utilization.
-
Progress tracking: as tasks are completed, the chart is updated, providing a real-time view of the project's status. This helps identify delays or deviations from the original plan.
-
Task dependencies: Gantt charts clearly display task dependencies, showing which tasks must be completed before others can start. This ensures that the project progresses smoothly and prevents unnecessary delays.
-
Milestone tracking: certain chart elements on your Gantt chart will be representing milestones—significant project achievements. These milestones act as checkpoints to measure the project's overall progress.
-
Communication and collaboration: Gantt charts provide a visual and easy-to-understand representation of the project's schedule. They facilitate communication among team members, stakeholders, and clients, ensuring everyone is on the same page regarding project timelines and deliverables.
-
Risk management: you can identify potential risks and bottlenecks early in the project lifecycle. By visualizing the critical path and understanding dependencies, you can develop contingency plans to mitigate risks.
-
Project coordination: Gantt charts foster better coordination among team members, as everyone can see how their tasks align with others' and how their work impacts the overall project timeline.
-
Decision making: effective Gantt chart helps in making informed decisions, such as reallocating resources, adjusting schedules, or prioritizing critical tasks, based on the project's progress and requirements.
Overall, Gantt charts play a crucial role in project planning and management. It enables teams to organize, monitor, and complete projects efficiently and successfully.
Gantt Chart Example
One of the most popular ways to create a chart with the Gantt method is to use an Excel Gantt chart in Microsoft Excel. You can find many examples of Excel Gantt chart template directly in Excel spreadsheet or on the Microsoft Excel website.
However, a Gantt chart in Excel might be difficult. Additionally, it's most suitable for large, corporate projects, projects with specific requirements, and for people who know how to move around Excel Gantt chart template.
To make your life easier, why not use a basic Gantt chart? Once you've created an Excel chart, you can move it to another tool, so you can have all your work in one place.
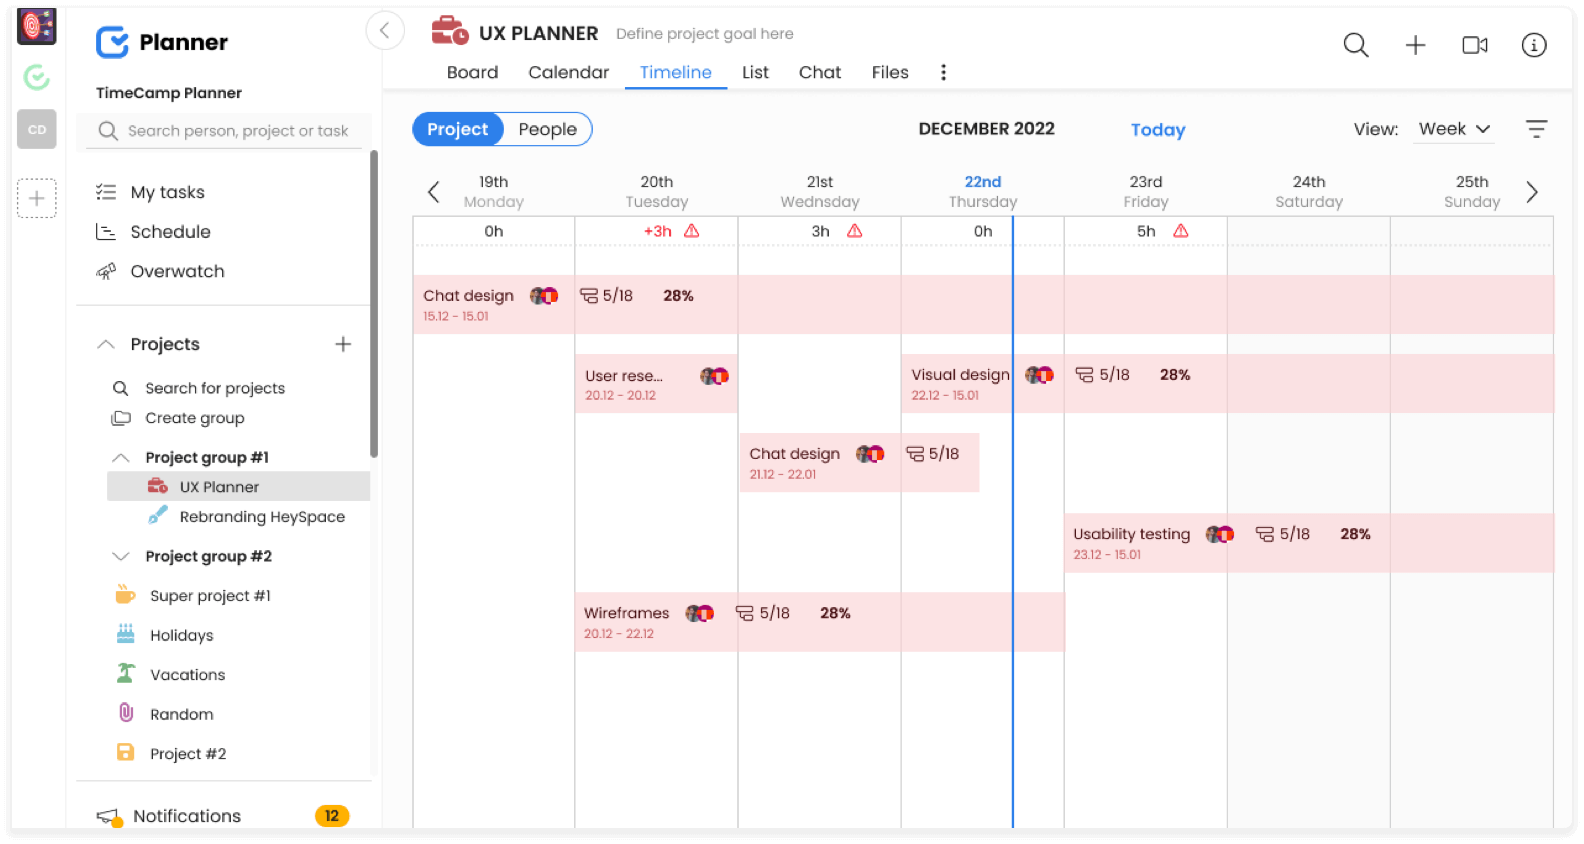
Here's an example of a simple Gantt chart in TimeCamp Planner, a scheduling and collaboration app. It includes all the crucial elements of a Gantt chart:
-
The chart area with a clear and concise design, so you and your team can view the entire project table at a glance.
-
Visible chart title with project tasks with column header.
-
A bar chart with a horizontal axis showing task descriptions, start date and end dates, and percent complete.
-
Vertical axis indicating current progress and showing duration data.
-
Legend entries remain visible, so you can see all the project data on the bar graph.
-
You can view project teams and employees' workload with availability (hours per week), number of open projects for each team member, open tasks, and overdue tasks.
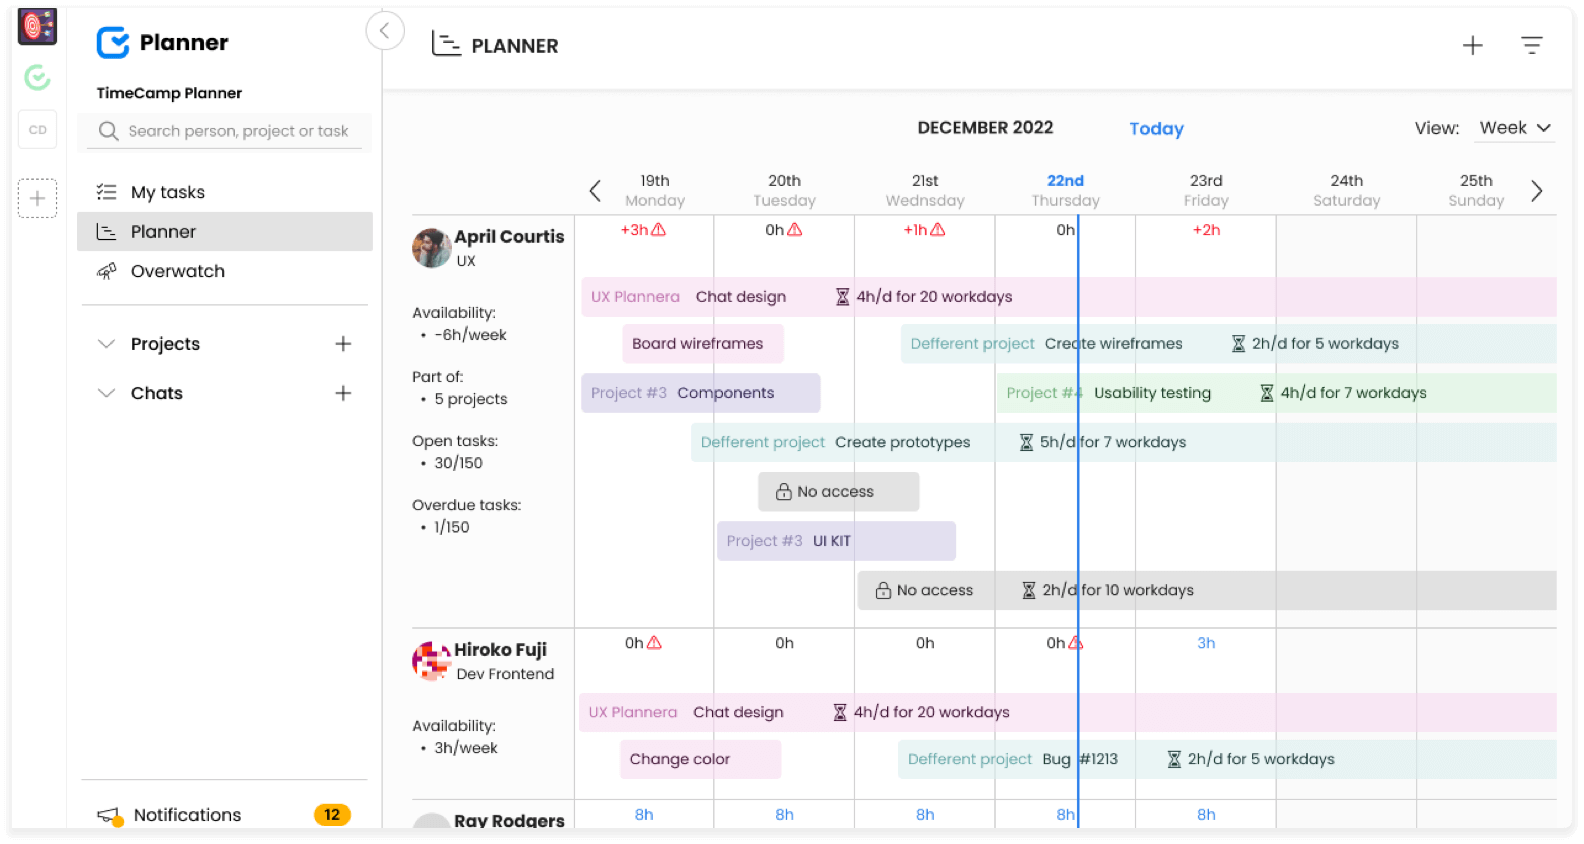
It's a simple Gantt chart template that can help you simplify complex projects. You can use it to replace the Excel Gantt chart template and eliminate tedious work.
How to Create a Gantt Chart: A Step-by-Step Guide
You may be using a complex Microsoft Excel Gantt chart template with an Excel stacked bar chart and a lot of information, or a simple planning tool. No matter what you choose, there are certain steps to take before you start drawing your Gantt chart, first task, and axis labels.
Here's what you need to do step-by-step to create an effective Gantt chart:
1. Define the Project Scope
Before creating a Gantt chart, it is essential to clearly understand the project's objectives, scope, and deliverables.
Start by understanding the project's purpose and the desired outcomes. What problem does the project aim to solve, and what are the specific goals and objectives? Clearly state the project's mission and what it intends to achieve. What is within the scope of the project, and what is not?
It'll be necessary to answer such questions to avoid putting too many objectives on your Gantt chart. The more precise your project plan, the more likely you are to prevent scope creep.
2. List Tasks and Activities
Break down the project into smaller tasks and activities, ensuring that each one is clearly defined and manageable.
TimeCamp Planner allows you to create tasks and list all your activities in a to-do list, or checklist. You can add as many tasks to a project as you need. Also, you can include additional items and project data to better define work and manage resources.
3. Estimate Task Duration
Determine the amount of time required to complete each task, taking into account factors such as resource availability and potential challenges.
Be specific about your start date and end date to make your Gantt chart as specific as possible. That way, you'll achieve all project objectives. Remember that not giving a precise end date will make each bar chart endless.
4. Identify Task Dependencies
Establish the relationships between tasks and determine which tasks must be completed before others can begin.
Some tasks can have the same start date and end date, some can intertwine. But there are tasks that can significantly influence the project schedules. Thus, you need to decide whether tasks are codependent or independent.
5. Choose a Gantt Chart Tool
Select a Gantt chart software or application that best suits your needs. There are many options available, including dedicated project management software and online tools.
You can make a Gantt chart in Excel, draw it on a piece of paper, use an app, or combine it all for the best results.
A good scheduling tool, such as TimeCamp Planner, provides you with functionalities to create a Gantt chart based on your task descriptions. It helps to automate and simplify work.
6. Create the Gantt Chart
Input your task list, durations, and dependencies into the chosen tool. Customize the chart's appearance and format as desired. Once you have the right tool, you can make a Gantt chart that corresponds to your business and project needs.
7. Update and Monitor
Regularly update the Gantt chart as the project progresses, adjusting task durations and dependencies as needed.
In TimeCamp Planner, the Gantt chart's chart area provides you with all the important project information in one place. That way, you can easily view what's happening in real time.
What to Include in Gantt Chart?
A well-constructed Gantt chart should include essential elements that provide a comprehensive overview of the project's schedule and progress.
Here are the key components to include in an effective Gantt chart:
All project tasks, their specific names, and activities.
-
Timeline with the horizontal axis, typically broken down into days, weeks, or months.
-
The length of the task bar on the Gantt chart that represents the time required to complete the task.
Task dependencies marked by arrows or connectors.
Milestones or checkpoints on the Gantt chart.
Percent complete.
Critical path represented by the longest task bar.
Start date and end date.
Additional elements you can include may be: a stacked bar chart, different colors or shades, key events or dates, other resources, a legend that explains the symbols, colors, or codes.
Remember to keep your Gantt chart clear and easy to understand. Avoid cluttering it with excessive detail, and ensure that the information is regularly updated to reflect any changes or adjustments to the project's schedule.
Timeline Gantt Chart: A Key Component of Project Management
A timeline Gantt chart is a variation of the traditional Gantt chart that emphasizes the chronological order of tasks and milestones. It provides a clear visual representation of the project's timeline, helping every project manager and team members identify potential bottlenecks or delays in the schedule.
In general, it's a specific type of Gantt chart that focuses on presenting project tasks and activities in a simplified, high-level view. It provides a clear and straightforward timeline of the project's activities, without the detailed dependencies or resource allocation often found in traditional Gantt charts.
You can also use sample Gantt charts or make your personal customized Gantt chart in your favorite tool.
Where to Make a Gantt Chart?
You can create Gantt charts in a simple and effortless way, using TimeCamp Planner. It's a robust planning and collaboration app with powerful scheduling and management features.
You can avoid all the hassle with complicated Microsoft Excel Gantt chart formulas and do everything with just a few clicks. TimeCamp Planner has all you need for a perfect Gantt chart:
-
You can easily convert part of your conversation into a task and turn it into a Gantt chart.
-
Add all the project details—assign tasks to particular people, add tags, create a to-do list, description, and files, comment on it, and watch overdue tasks.
Make tasks recurring to automate workflow.
Set a due date and monitor progress on an ongoing basis.
-
You can connect with your team via different communication channels (individual or group chat, comments and notes within a task, or make a video call).
-
The feature of workspaces allows you to create many spaces and make multiple Gantt charts.
-
To be more effective, you can connect it with TimeCamp time tracker to track time for an accurate schedule.
Gantt Chart Project Management: Enhancing Efficiency and Collaboration
Gantt charts offer numerous benefits for project management. The Gantt chart visually represents project schedules, aiding efficient task planning and progress tracking for timely project completion. That improves productivity.
But you can benefit from using it in other ways:
-
Improved communication: Gantt chart provides a clear, visual representation of the project schedule, making it easier for team members and stakeholders to understand project progress and expectations.
-
Better resource allocation: Gantt chart allow you to identify resource constraints and allocate resources effectively.
-
Enhanced collaboration: by illustrating task dependencies, Gantt chart promotes teamwork and collaboration among project team members.
-
Accurate progress tracking: Gantt chart enables scheme managers to track progress and identify potential delays or issues in the project timeline.
-
Increased efficiency: Gantt chart helps to identify opportunities to streamline the project schedule and optimize task sequences.
Mastering the Art of Gantt Chart Creation
Gantt chart is an essential tool for effective project management. It offers a clear, visual representation of a project's timeline, tasks, and dependencies.
By understanding the basics of the Gantt chart and following our step-by-step guide, you can create a powerful tool that improves communication, collaboration, and efficiency within your project team. Embrace the power of Gantt charts and take your project management skills to the next level.