ISO27001
International standard for information security management systems.
Get real-time insights into all employee activities. Monitor work habits, detect inefficiencies, and utilize precise analytics built for large organizations to boost productivity and employee performance.
Supervise all kinds of employee work
Improve productivity and employee performance
Optimize resource and cost allocation
Prevent fraud by monitoring activities
TimeCamp is a workforce analytics platform designed to drive higher productivity across all industries with customizable options and specialized features.

Apart from cloud solution you can take advantage of other deployment models:

We provide a dedicated Service Level Agreement and priority support:

Our platform can be tailored to fit your company specific requirements:

Designed for high performance and scalability:

Integrate TimeCamp with BI tools for deep insights, dive into metrics with customized reports, and securely store and manage large datasets.

Our consultants can assist you with:

Book a short, focused call to see TimeCamp configured for your organization’s structure, approval flows, and reporting needs.

Get a guided product walkthrough and a tailored offer
Get your questions answered in real-time
Check how we sync with your current tech stack
TimeCamp is committed to compliance with formal regulations, ensuring your data is handled securely across all processes.

International standard for information security management systems.

Comprehensive data protection law aimed at safeguarding individuals' privacy rights.

Annual audit certification for Service Organization Controls Trust Services Principles.
15.82%
Our clients experience an average increase of 15.82% in productive hours since implementing TimeCamp.
82.2%
Ease of use drove 82.2% of our users to choose TimeCamp over other time trackers.
TimeCamp is trusted by diverse enterprises worldwide. Our platform adapts to a variety of industries, providing tailored solutions that drive productivity and operational excellence.


See how organizations like yours have enhanced their workflows with TimeCamp, acclaimed for its simplicity and user-friendliness - highly rated on G2 for ease of use.
"TimeCamp helps us effectively manage our remote workforce by providing clear visibility into workflows and robust tools for project collaboration. It has enabled us to easily pinpoint areas for optimization and drive measurable gains in team productivity."

Mateusz Westwalewicz
COO at Gonito"TimeCamp has given us much deeper visibility into how our teams tackle client projects. It allowed us to identify bottlenecks and drive a tangible increase in profitability, the bedrock of any agency model. Thanks to TimeCamp’s seamless integration with our existing ecosystem, we now monitor project margins at every stage, from initial estimation through to final invoicing."
Jarosław Miszczak
CEO at BlueRank"For any company looking to move away from guesswork and toward data-backed management, we highly recommend TimeCamp. It has become an essential part of the Senuto toolkit, helping us work smarter, not harder."
Damian Salkowski
CEO at Senuto


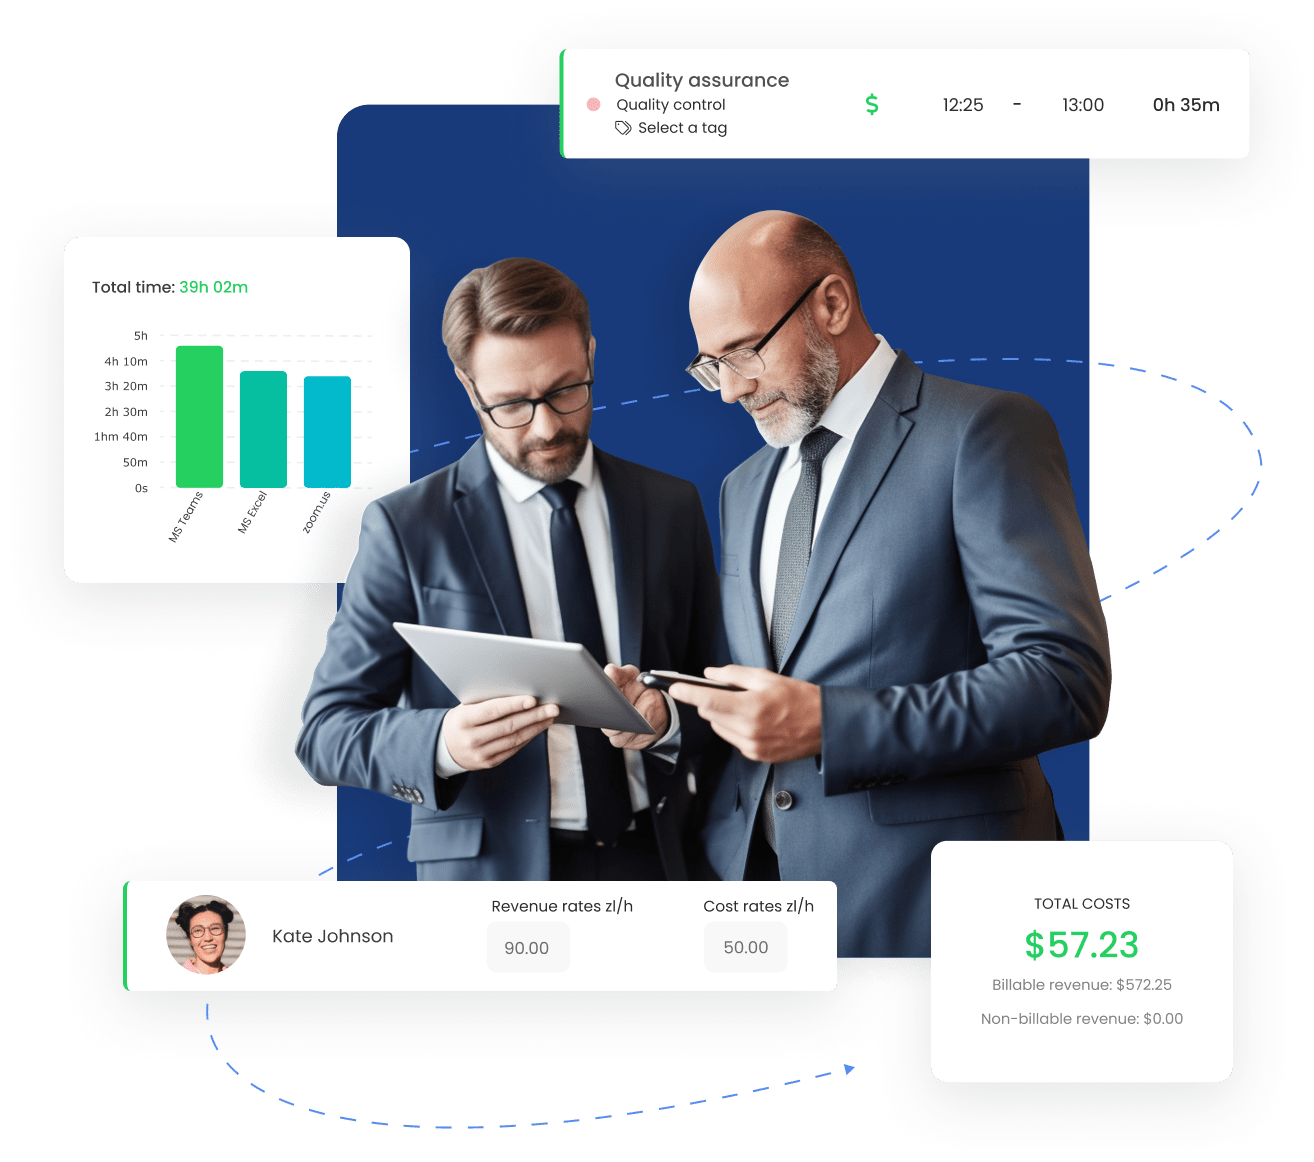
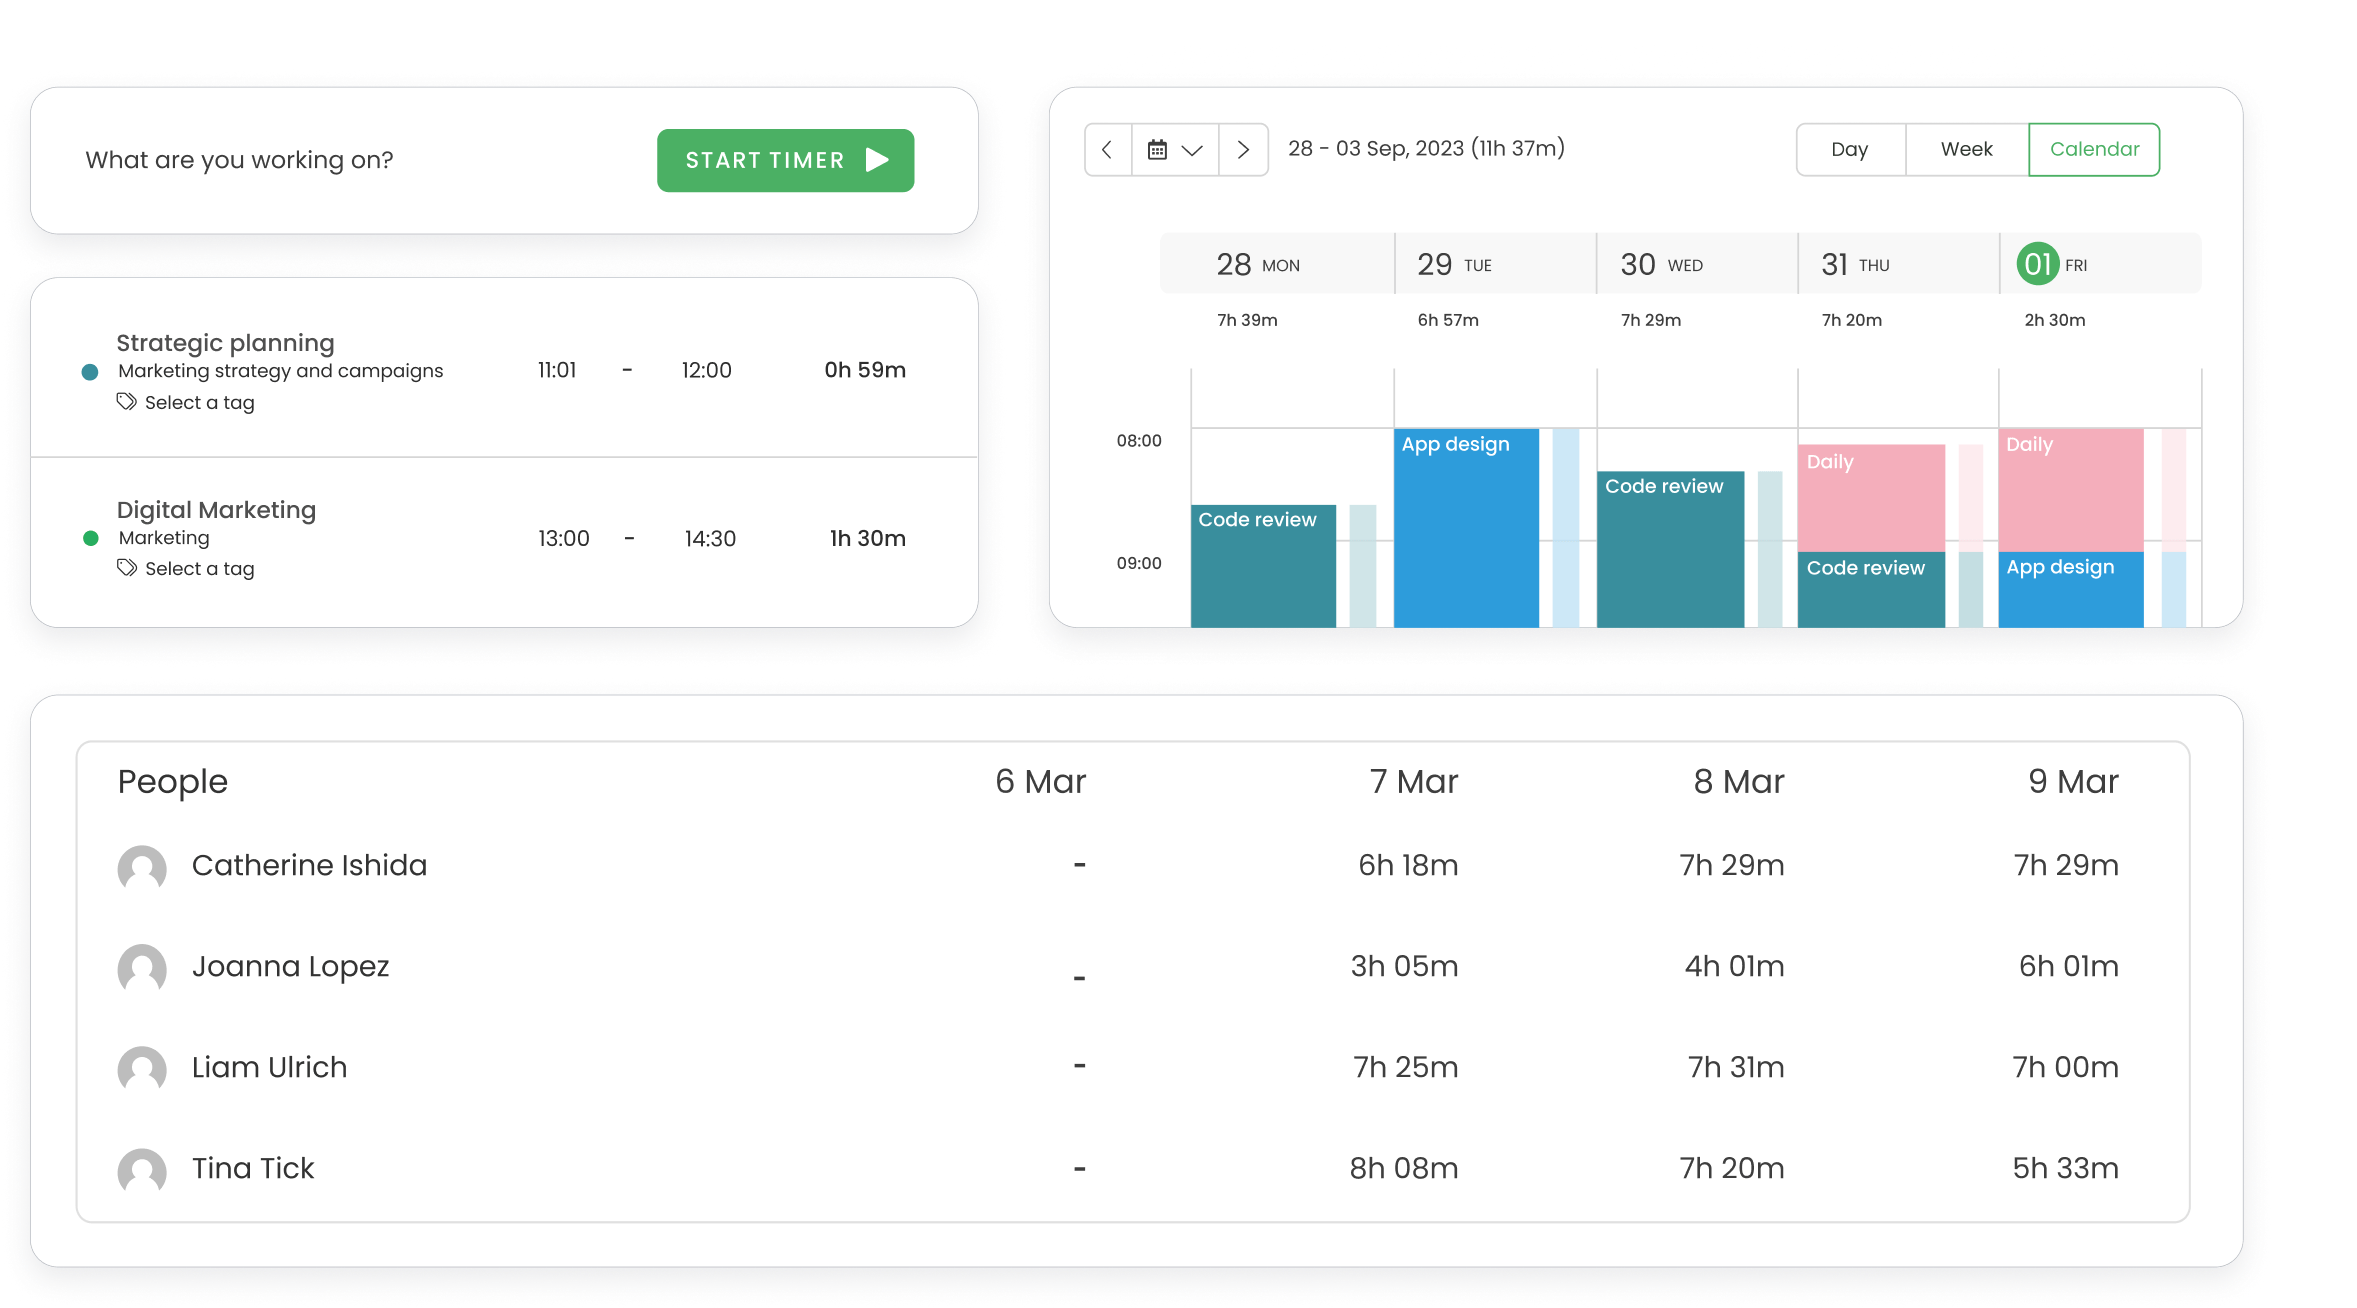
TimeCamp equips leaders with advanced tools designed to enhance transparency and maximize workforce productivity throughout your organization. Our platform delivers precise data on employee work hours, activities, and working patterns to help you analyze, understand, and optimize them for better outcomes.
Supervise your employees, whether they’re in the office, remote, or hybrid, to ensure tasks are completed on time and that duties are performed effectively. With TimeCamp, you can track work hours and activities, gaining clear visibility into your workforce’s performance.
Monitor employees’ working hours, regardless of their location
Ensure high levels of productivity and engagement
Analyze work patterns to detect and prevent fraud
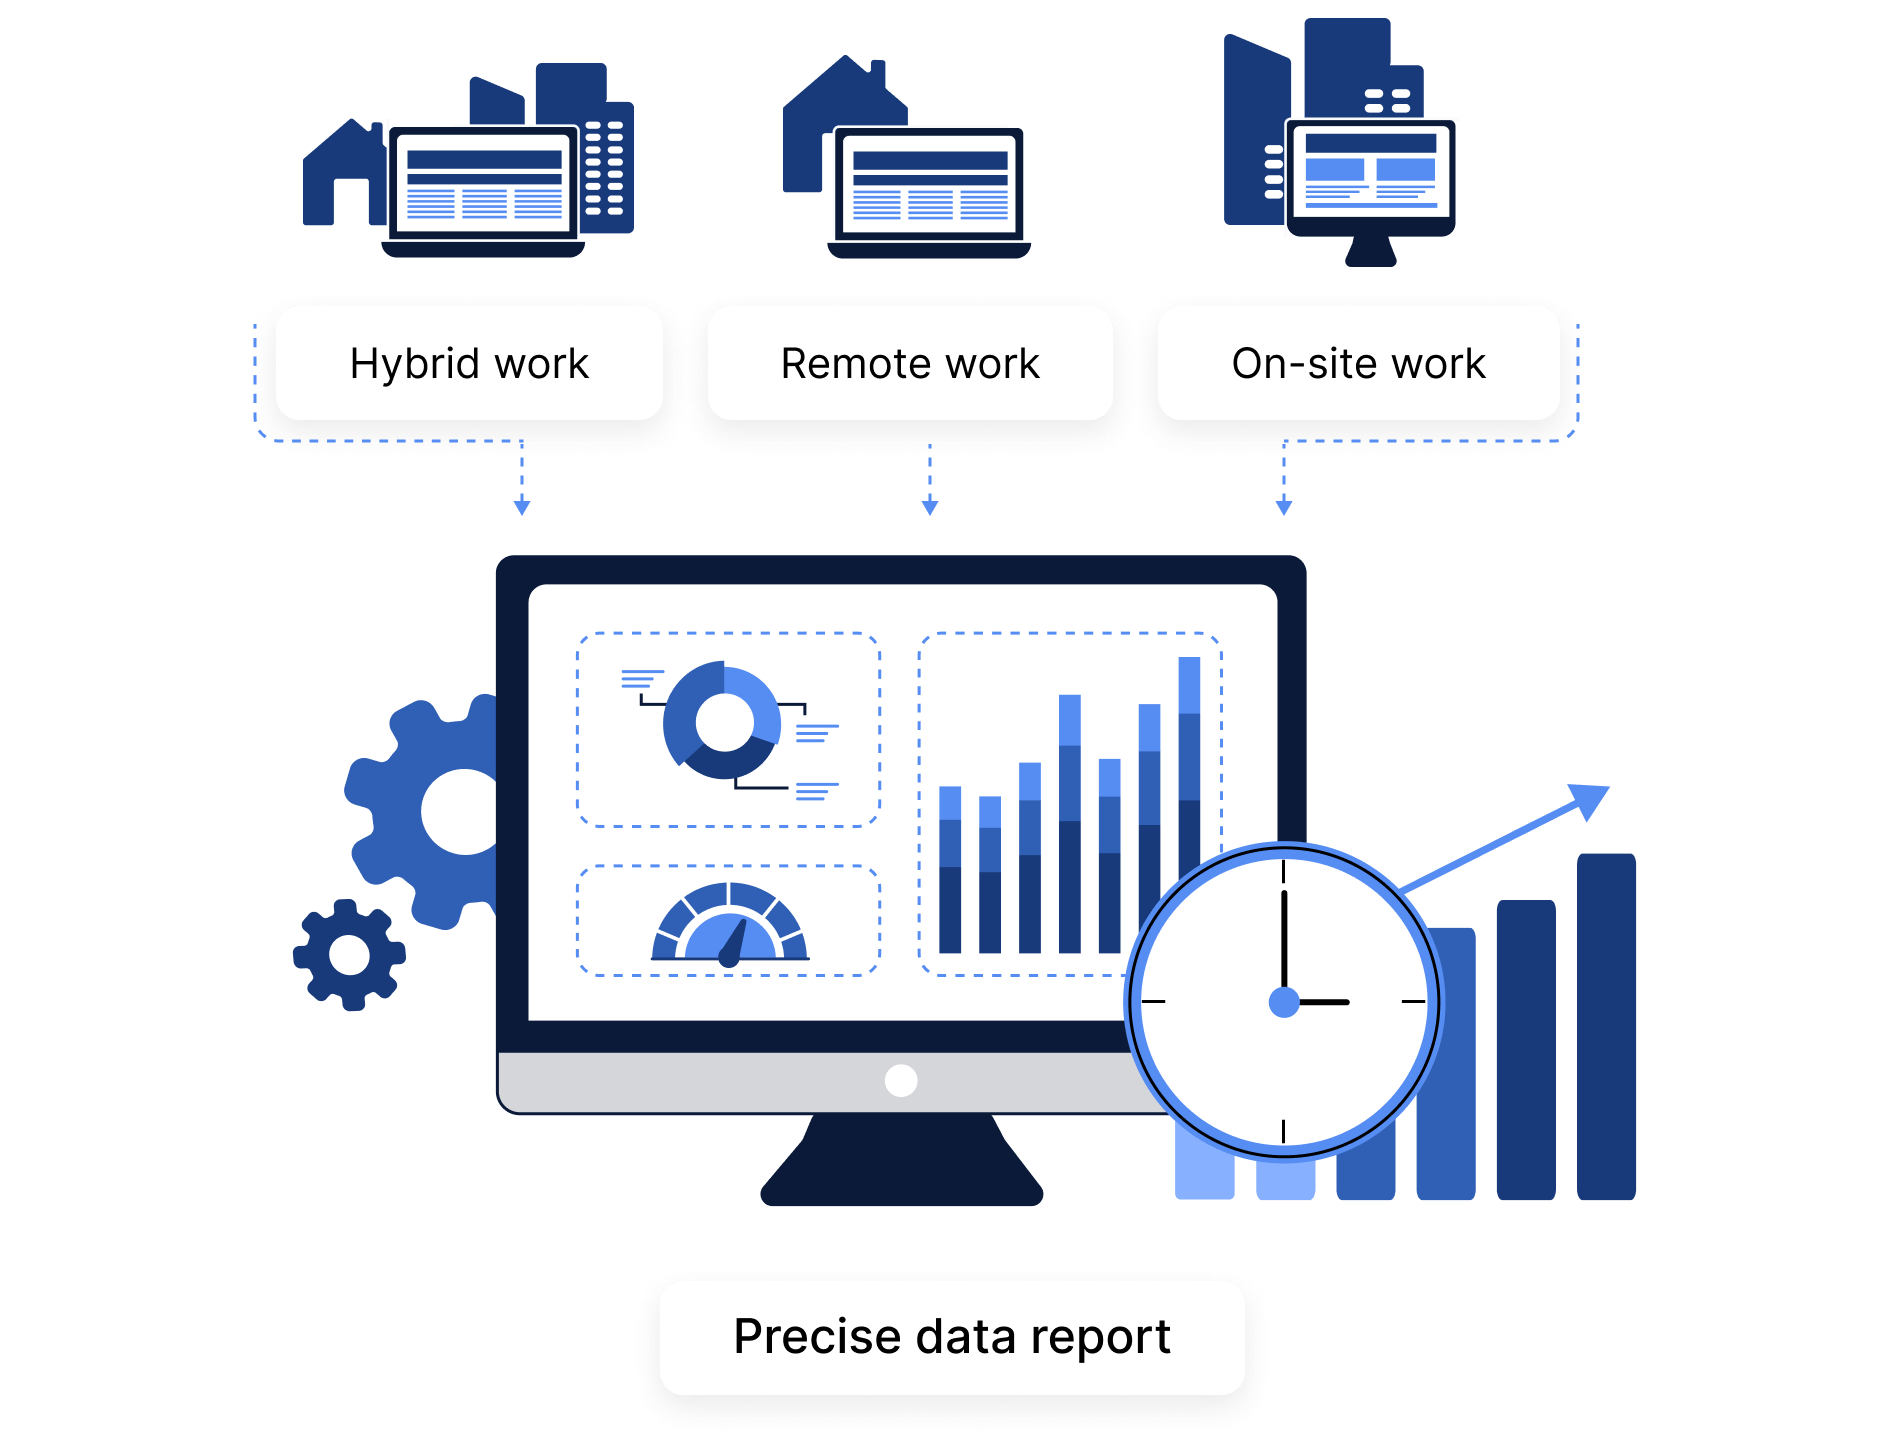
Empower your employees to maximize efficiency and drive cost-effectiveness. TimeCamp provides insights into how work time is spent and which software is used, helping you refine resource allocation and control operational costs.
Identify unnecessary spending on unused software.
Manage your team's workload to prevent delays and minimize downtime.
Enhance employee performance across different environments.
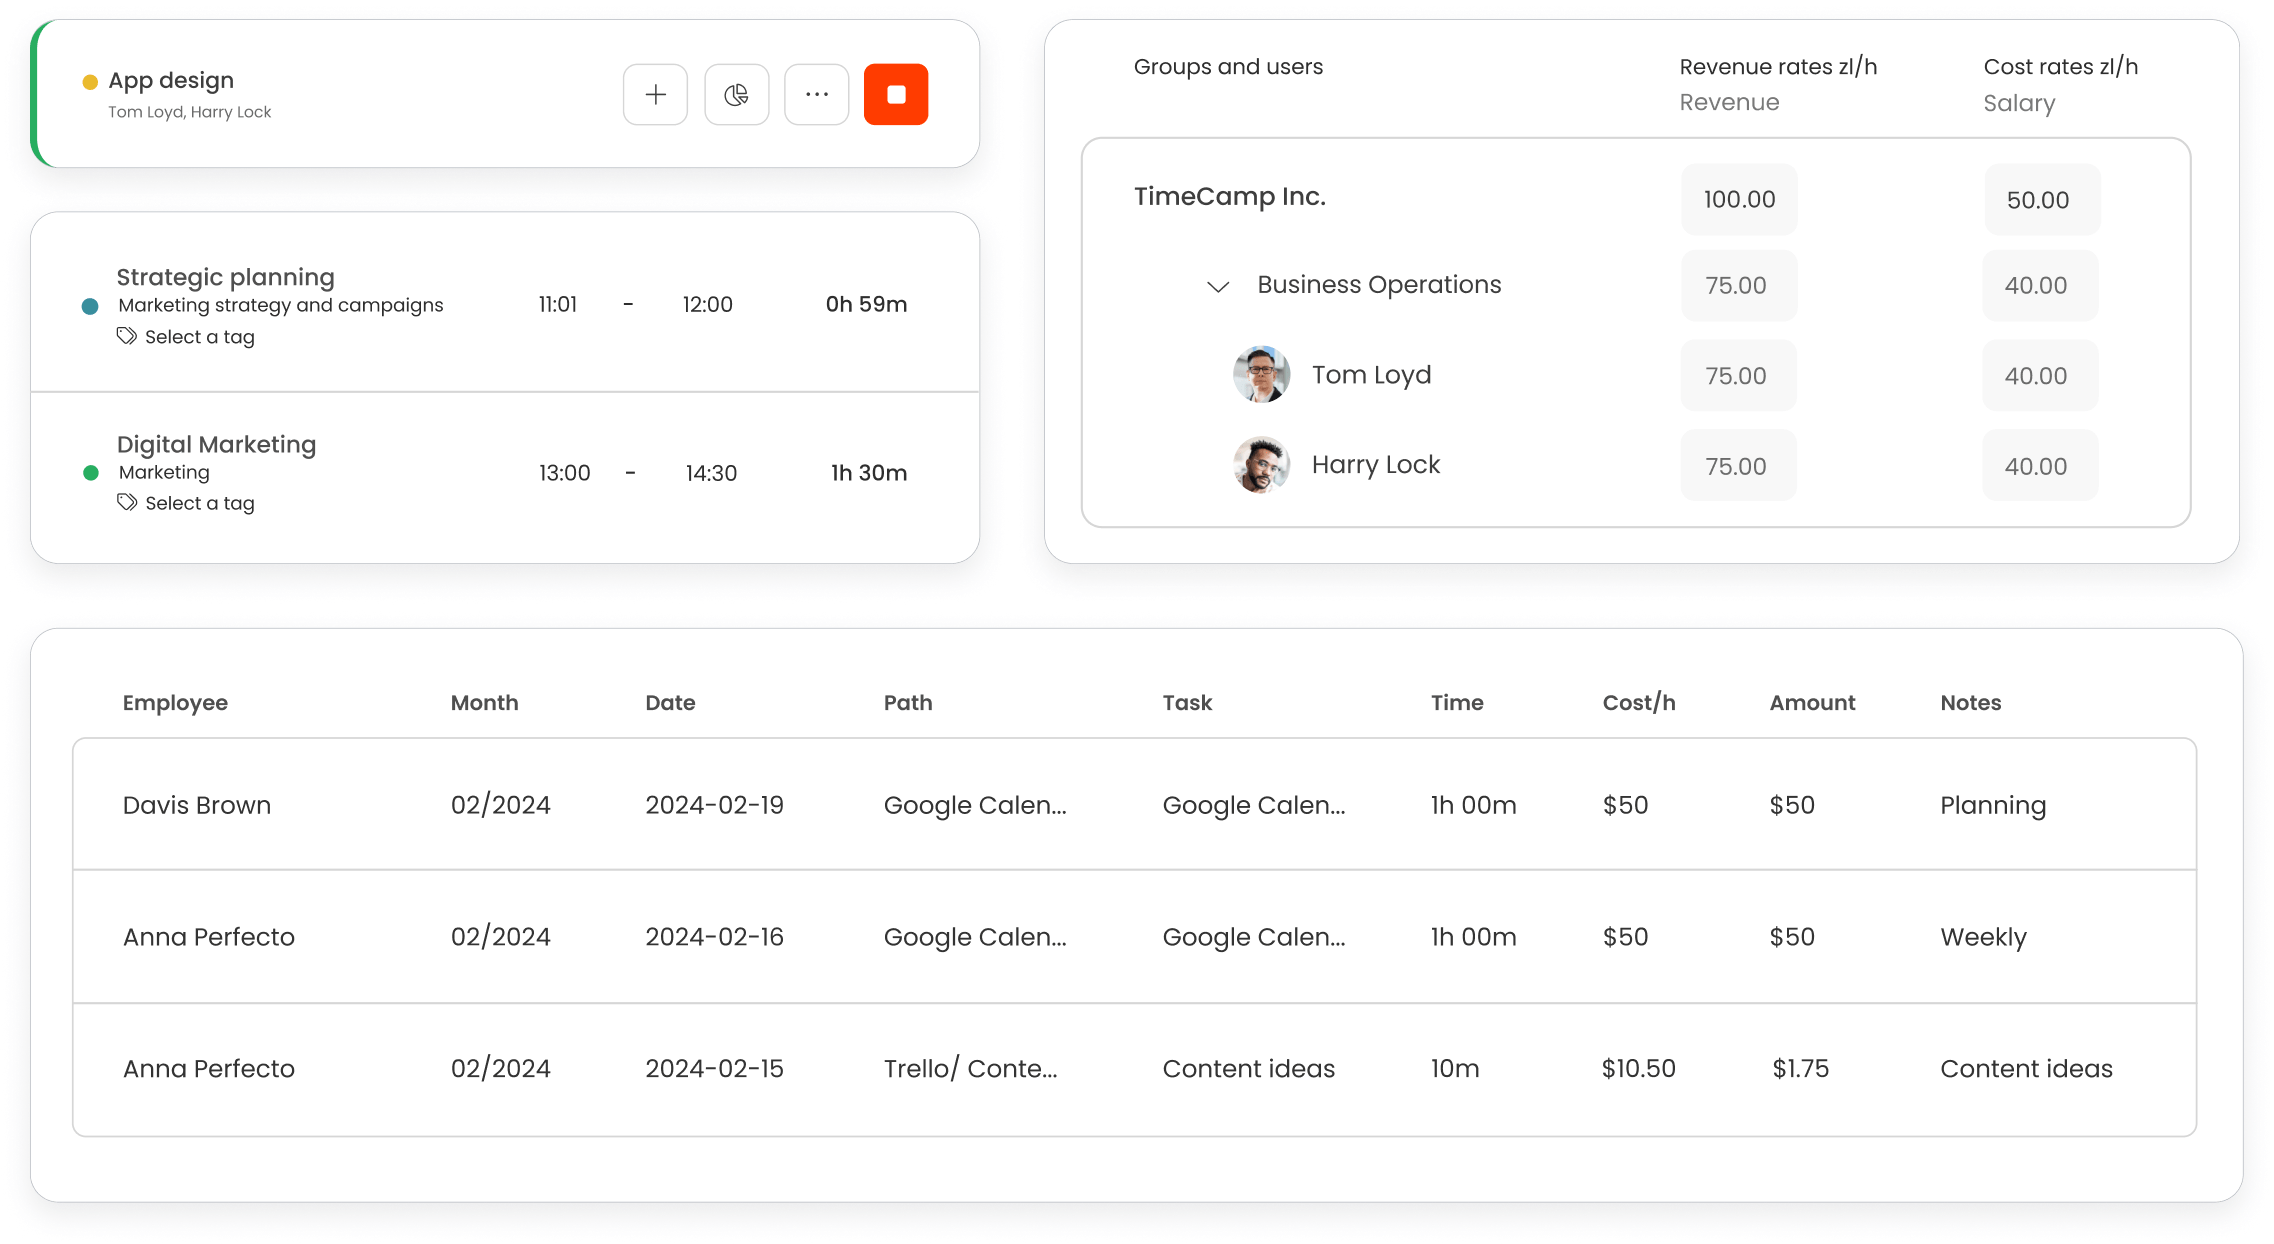
Leverage TimeCamp's advanced analytics to gain critical insights into employee productivity and behavior. Seamlessly integrate and analyze data within your BI systems by generating and exporting detailed, customizable reports in multiple formats.
Utilize historical data to uncover strategic growth opportunities.
Pinpoint areas for productivity improvement across departments.
Identify and resolve bottlenecks to consistently meet deadlines.
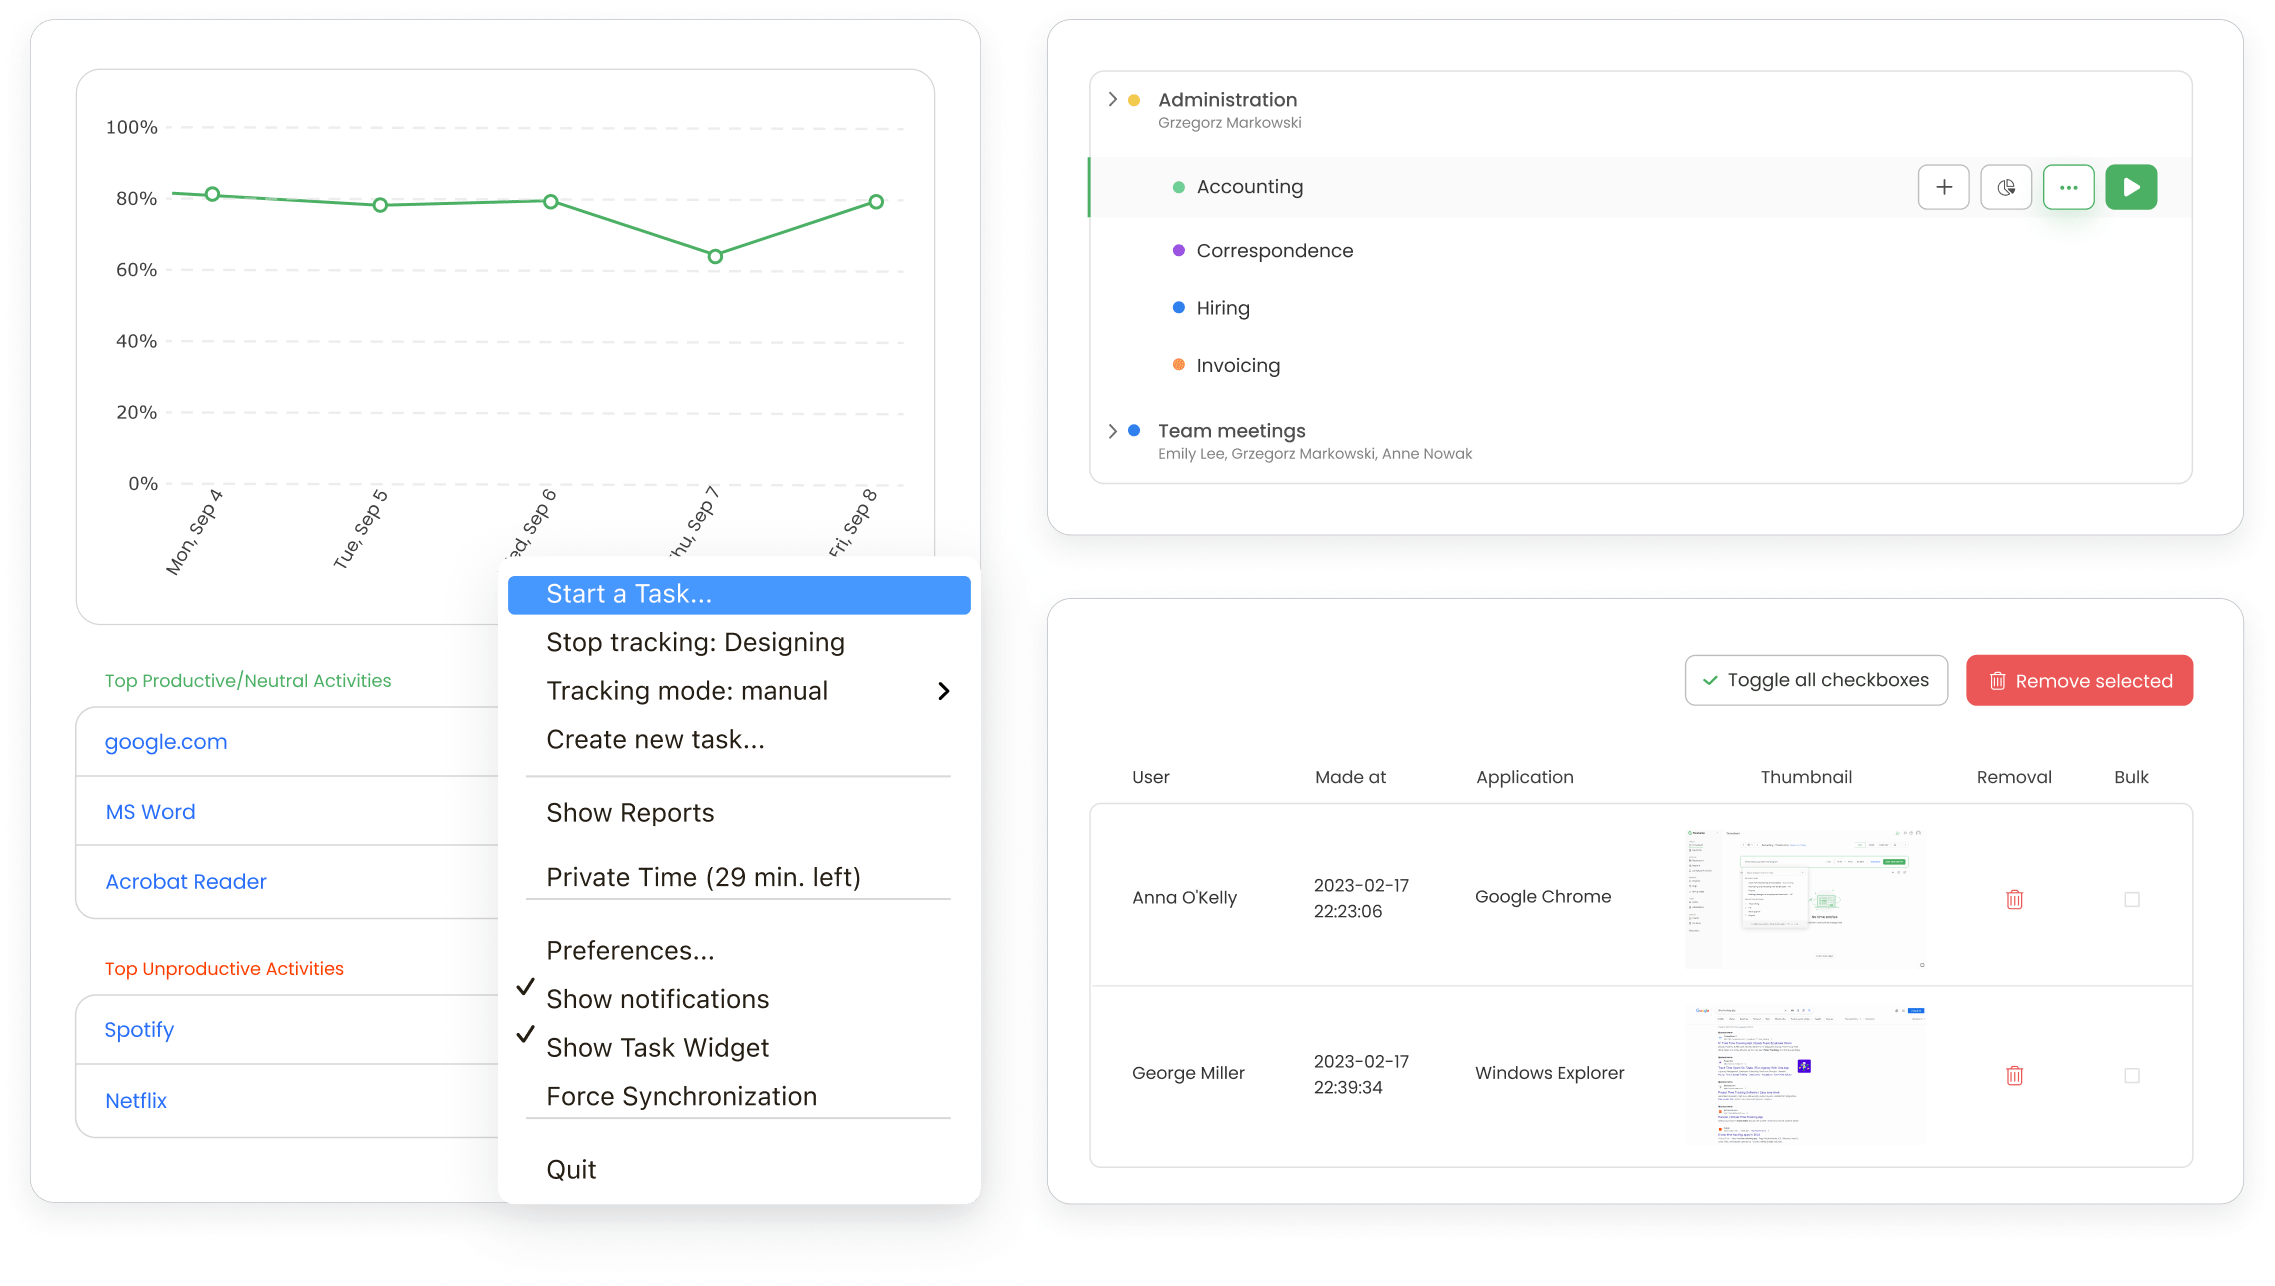
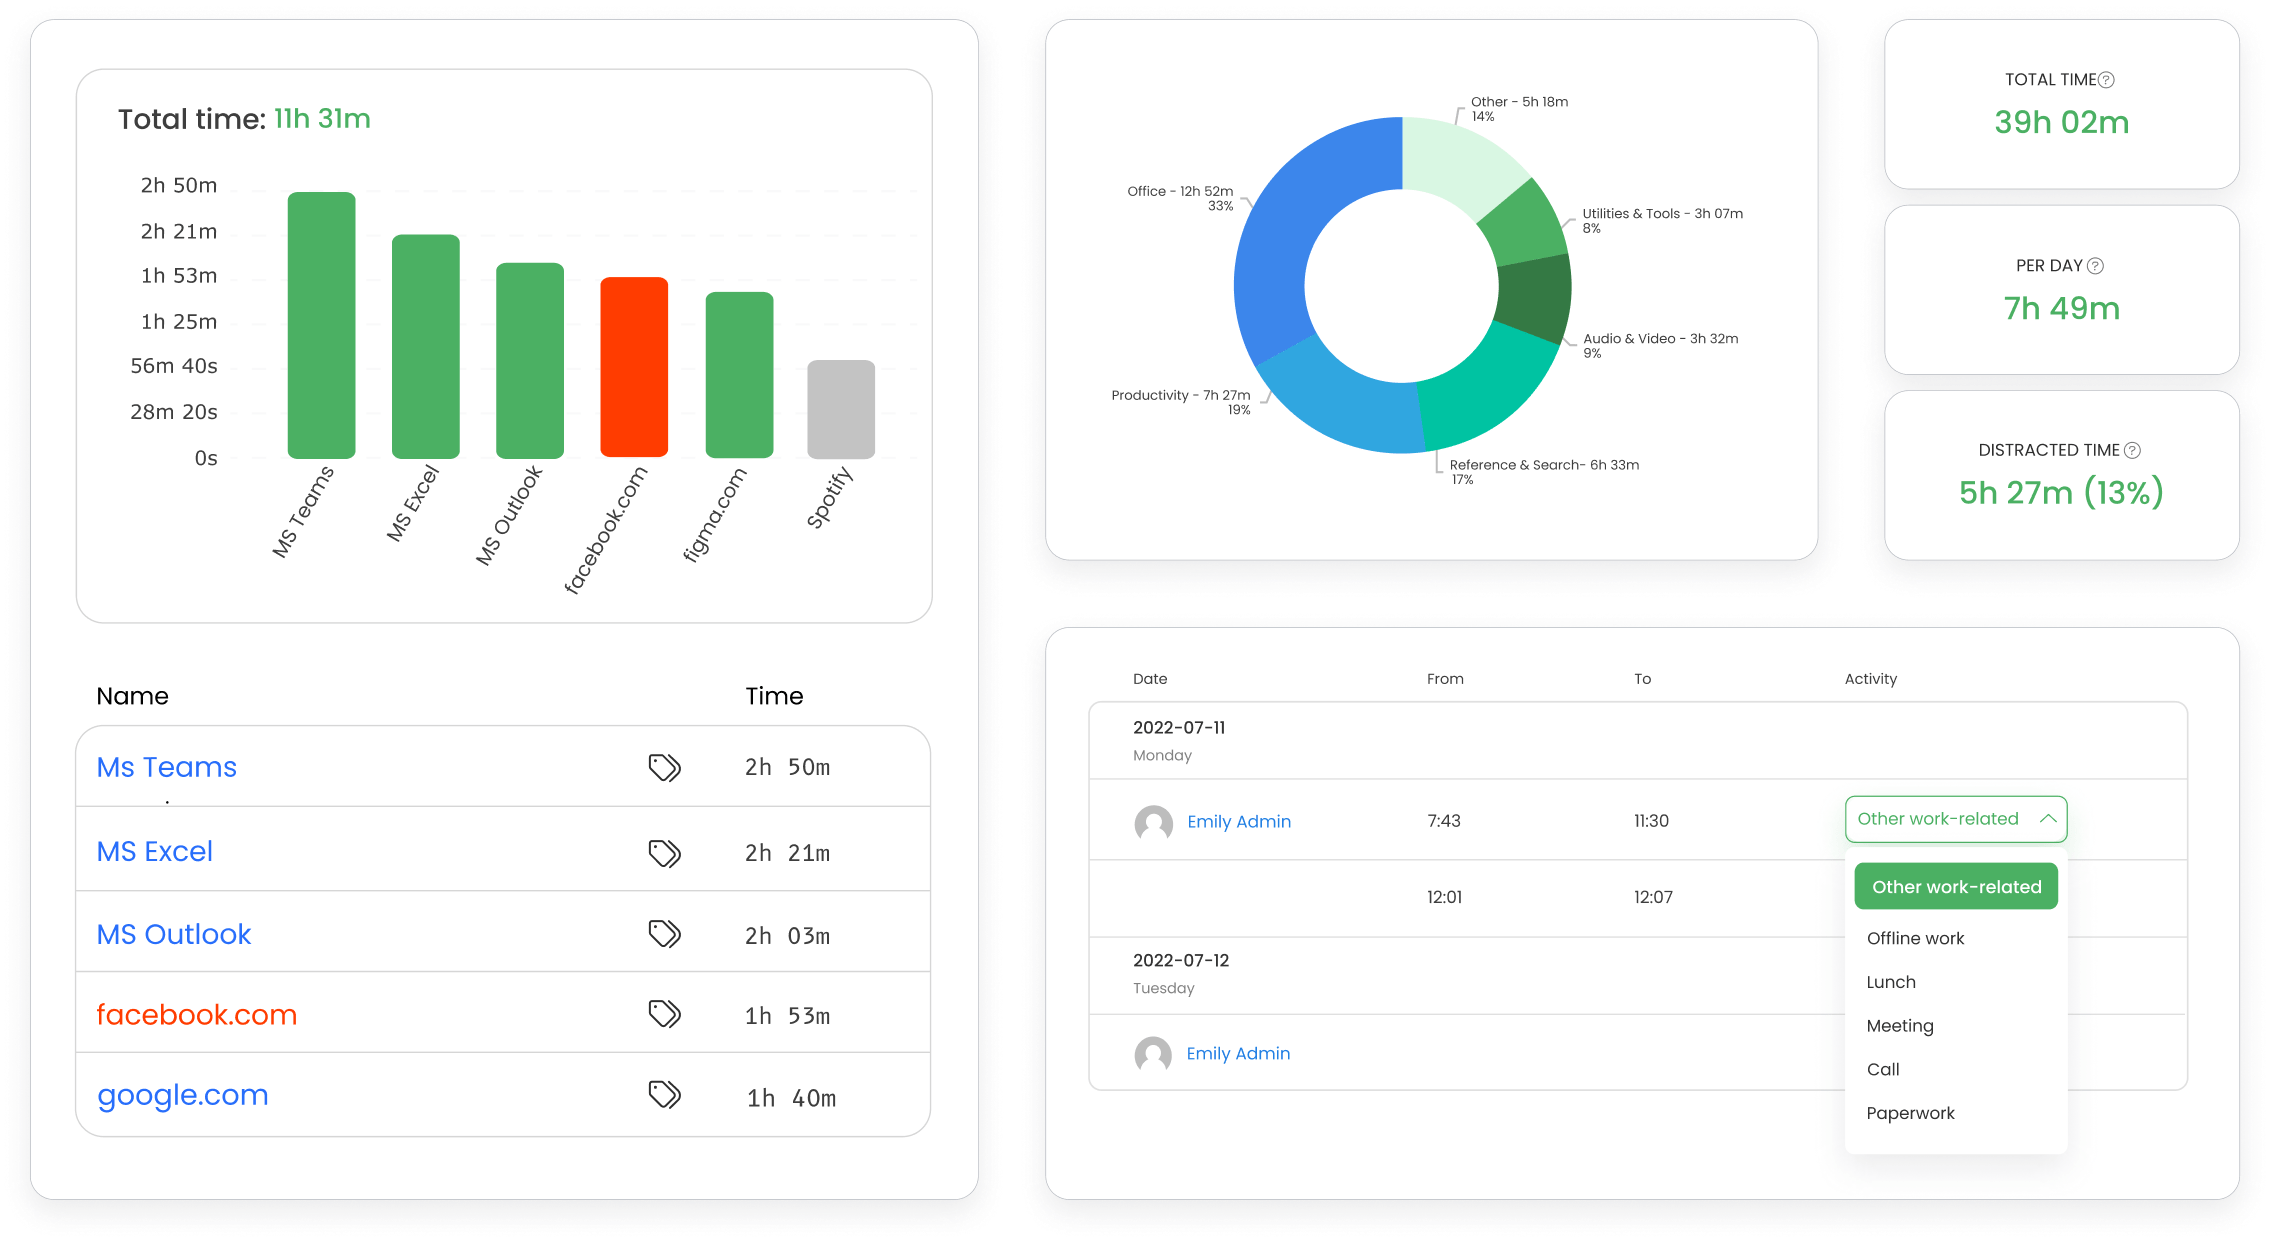
Gain complete visibility into employee activity during work hours. TimeCamp’s detailed usage reports help identify time-wasting behaviors and ensure compliance with company policies, improving focus and productivity.
Monitor employee activities to prevent inefficiencies.
Categorize sites and apps as either productive or distracting.
Detect activities that violate company policies.
TimeCamp integrates seamlessly with over 100 other tools, including project management software, CRM systems, and more, to keep your workflow uninterrupted.


Speak to Sales to discover how TimeCamp can help.