


A good project time tracking app can save the day and your budget! No one likes when unexpected circumstances make them spend extra time and money. Prevention is better than cure, so find out how time tracking tools can help you avoid painful overspending!
Why track time for projects?
Nothing gives you more control over a project than knowing you have enough resources to deliver the results of your work on time. Tracking time for projects using a good time tracking app ensures you this peaceful feeling, so you can focus better on what really matters. What kind of resources can you exactly control with it?
Time spent on tasks
You know how many work hours per day your employees have in their contracts, but have you ever tried to understand how they use their time within a workday? Which processes are the most time-consuming, and what tasks are easy enough to finish way before the deadline comes?
It's no rocket science these days to get these questions answered - even a simple time tracking software that is packed with basic reporting features provides you with tracking data for performance analysis.
Prepare a time report for a particular project or task and find out how many hours your employees tracked for it during a specific period of time. If you find the received numbers accurate, you'll be able to prepare better estimates for further projects. If not, it allows you to implement remedial measures and optimize the processes to avoid overspending.
Revenues vs. expenses
If you have a feeling that the money from projects flies away instead of increasing the company revenues, you shouldn't ignore it and just wait for better times. That often happens when project managers skip preparing estimations during project planning. But how to find out if a project is or will be profitable if you have nothing to compare it with?
A time tracking app allows for preparing better resource estimates based on the spending experience your team gained so far. Once you calculate the number of hours and the amount of money essential to complete your work on time, you'll be able to track the spending during the project and react accurately when the need for adjustment will appear. Stop skipping this step before you create a project - reaction in time is worth the effort of devoting extra time to thorough analysis!
Human resources
A project would not complete itself - you need people, your most precious resource, to do it. And not the randoms, but the employees who have appropriate skills for it. It's not that people are waiting patiently for their turn to earn the glory - they usually have so much on their plates that the perspective of extra work gives them a headache.
However, a project time tracking tool tells you straight about the state of the workload of your team. Analyzing the detailed reports, you can find out who's working on what and how many work hours they've already spent on particular projects and tasks. If a project time tracker you use is packed with an attendance tracking module, you can stay up to date with your employees' vacations and sick leaves to distribute the work more efficiently.
How does TimeCamp, a free project time tracking app, support efficient project management?
A wide range of time tracking and time management features offered by TimeCamp makes it one of the top project time tracking apps. Thousands of satisfied clients cannot be wrong ;)
What of TimeCamp assets make it the best time tracking app for project time estimation and tracking?
Automatic time tracking
Why waste time on manual timesheet filling when TimeCamp seamlessly assigns time entries to the appropriate projects and tasks? Download a Mac, Windows, or Linux desktop app, enable Automatic time tracking features, and enjoy tracking work hours without remembering about switching between projects or tasks when you start working on something new.
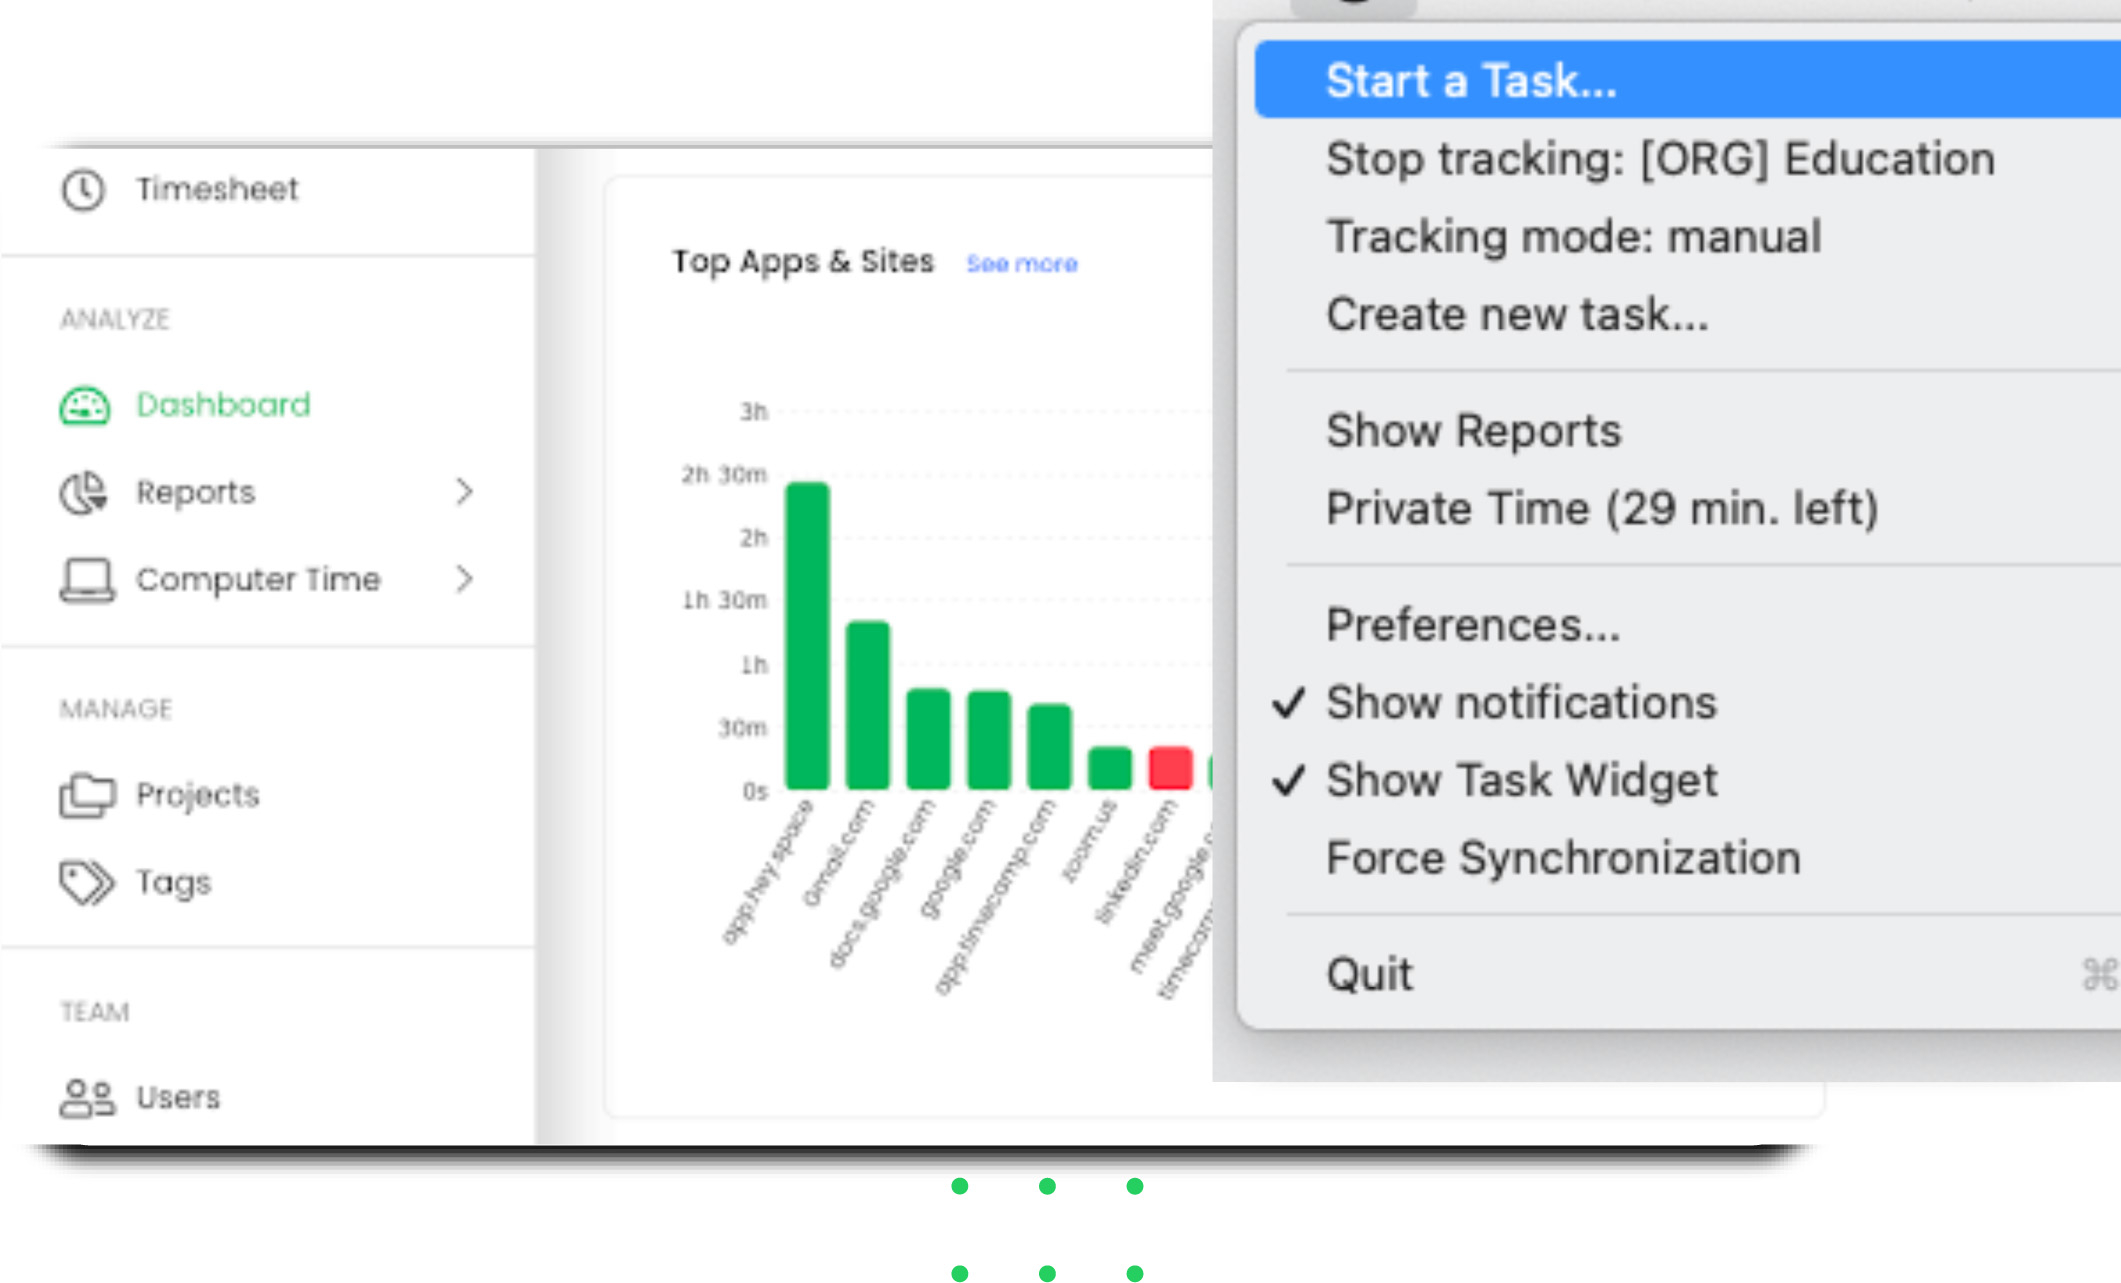
Once you download the desktop app, you only need to enable the keywords feature and determine the keywords set for specific projects. This way, the tool automatically recognizes the activity each time when the keyword appears in the open window, e.g., in the file or folder name, in an address of a browsed website, or used app.
Remember to be as specific as possible when adding new keywords to the list. It's a general rule that applies to TimeCamp as well - the tool won't recognize keywords that are too vague, like, e.g., content writing. Try to use the names of the tools you use instead!
Desktop apps track time in the background, automatically fill your timesheets with working hours, assigning entries to the appropriate projects. It's a perfect solution if you struggle with maintaining an appropriate level of focus - the app does the dirty job and reduces distractions to the minimum!
A multitude of time tracking ways
Besides being a robust automatic time tracker, TimeCamp allows you to track time for projects using:
- Mobile time tracking apps for iOS and Android to let you track time wherever you are,
- Web app that allows tracking time manually by adding new time entries or just starting a timer,
- A week view that fills your timesheets with time entries even for an entire week at once,
- Time clock kiosk that uses a shared device and unique 4-digit PIN codes,
- 30+ direct integrations with tools like Trello, JIRA, Asana, Monday, Clickup, Zendesk, Salesforce or Azure DevOps,
- Browser plugin for Chrome and Edge that extends the list of tools TimeCamp integrates with to 70+
Billable hours
To get a full overview of how much you can charge a customer for a project, you need to track billable hours and non-billable hours. The first mean time spent on the activities you can be described as actual work on the project assignments, and the latter - is mostly administrative costs that cannot be billed.
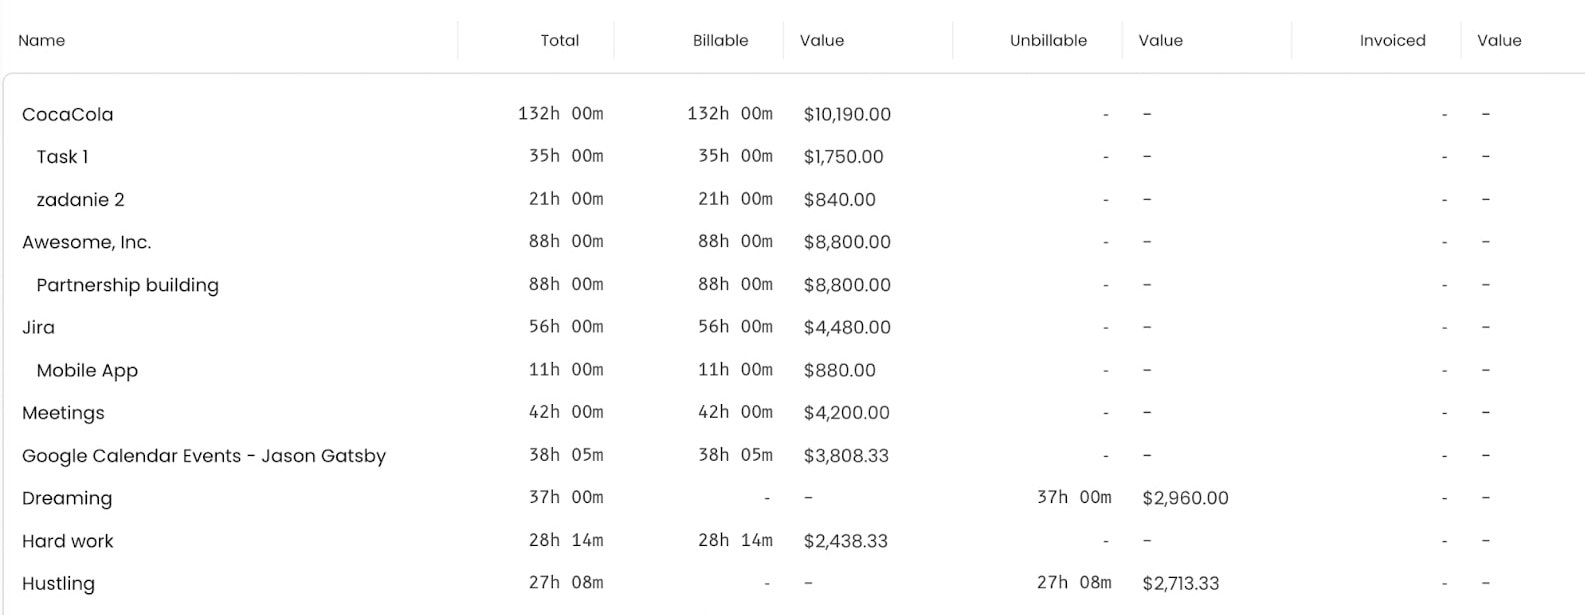
In TimeCamp, you can assign each time entry as billable and easily add your billable hours to an invoice. You can also define whether the time for a certain task should be billable by default.
Detailed reporting
Time reporting feature in TimeCamp allows you to control your company's time and money resource usage. It uses all the time tracking data registered by timer, apps, time clock, or by manually filling timesheets with time entries to give you a complete overview of total hours tracked per employee, projects, and tasks.
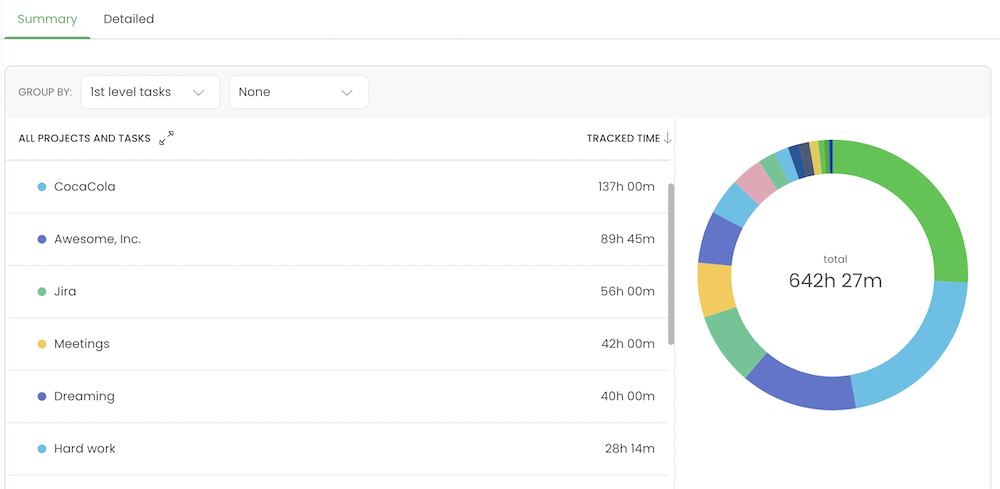
Besides the multitude of preset report templates, TimeCamp offers custom reports in the form of a pivot table. Choose the variables you need, drag and drop them into the table and generate the reports however you like.
Integrations
TimeCamp integrates directly with 30+ tools for project management, sales, CRM, accounting, and many more, like Trello, JIRA, Asana, Monday, Clickup, Zendesk, Salesforce, or AzureDevOps. It mostly allows you to track time directly from your project management tools, implementing a time tracking button into the task view of your favorite app.
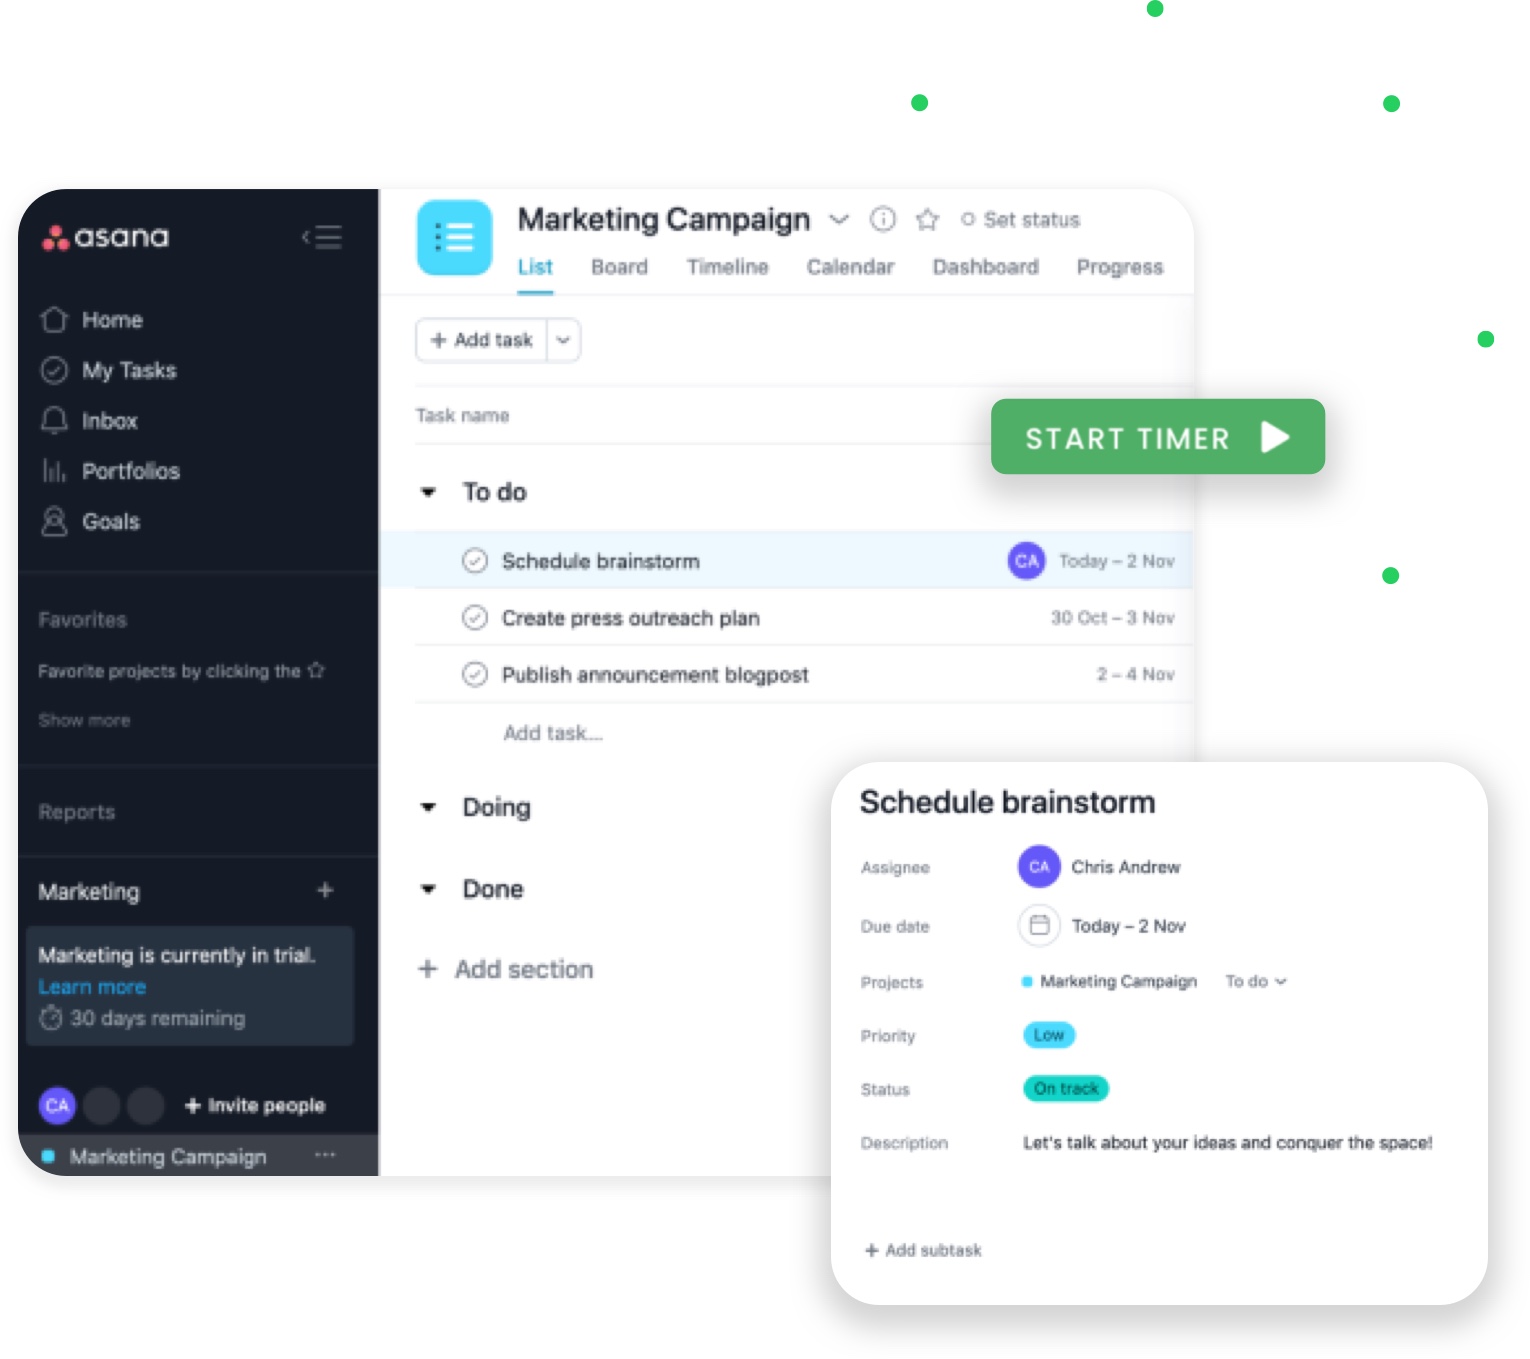
If the integration doesn't include an in-app button, you can import the entire project structure to TimeCamp and track time manually for them or start a new timer, choosing the project/task from the task picker of the timer bar in the timesheet view.
Adding TimeCamp, a simple time tracking app to CRM, sales, accounting, or project management tool, helps you create invoices or detailed reports from time entries assigned to the particular task that's already been created in the tool you use.
Check the full integrations list here!
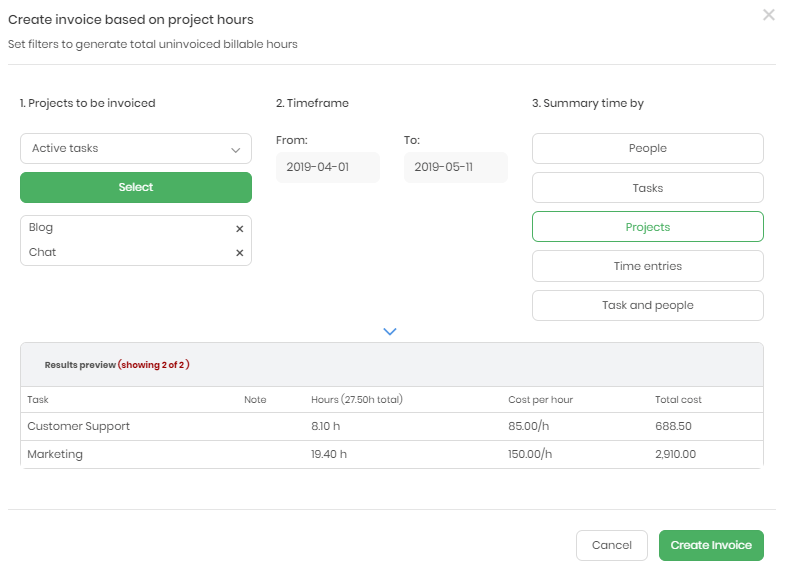
Invoicing
With TimeCamp, you can invoice your customers based on time tracked for a specific project or by creating a blank document. Such a handy option saves you time on administrative processes and allows you to keep the documents in order without using third party apps. Invoices can be sent to your Clients directly as emails, or you can create a public link or download a PDF file and show it to your customers or contractors however you like.
Moreover, integration with your PayPal account is available - use it to track your payments for issued invoices on an ongoing basis.
How much does TimeCamp overtime tracker cost?
TimeCamp offers affordable pricing for teams and freelancers with various needs:
-
Free time tracking app - a free version of TimeCamp for unlimited users includes all the essentials for effortless the best overtime tracker app should have - automatic time tracking, project tree structure, time clock kiosk, desktop, and mobile apps, and many more,
-
Starter - $2.99 per user per month, including unlimited tasks, excel reports export, attendance, time-off, overtime tracking
-
Basic - $6.99 per user per month, including unlimited integrations, billable time, budget & estimates, apps & websites tracking, project archiving, and more,
-
Pro - $10.99 per user per month, including billable rates, labor costs, invoicing, timesheet approvals, custom user roles, and more
-
Enterprise - custom pricing, contact sales team for more details